Interview Brush-Up · Uptime and releases
Reliability vs availability: why 99.97% uptime can still mean 24 outages a day
In one line: Availability: is it up right now? Reliability: how long does it run before it fails?

Your service dashboard shows 99.97% uptime for the month. Everything is green. Then support forwards a pile of complaints: payments failing, uploads lost, people logged out halfway through checkout.
Both stories are true at the same time. The dashboard measures availability. Your users are complaining about reliability. The two words get used as if they mean the same thing, but they answer two different questions, and you fix them with different tools.
Two different questions
Availability: “Is it up right now?” The share of time the system is up and serving requests. You measure it as an uptime percentage, usually quoted in “nines”.
Reliability: “How long does it run before it fails?” How long the system keeps working correctly between failures. The classic measure is MTBF, the mean time between failures.
Availability is a snapshot: at any given moment, are you up? Reliability is about a stretch of time: how long can you go without breaking? A system can score well on one and badly on the other, and the two cases below show both ways.
Case 1: available, but not reliable
A service crashes every hour and restarts in 1 second.
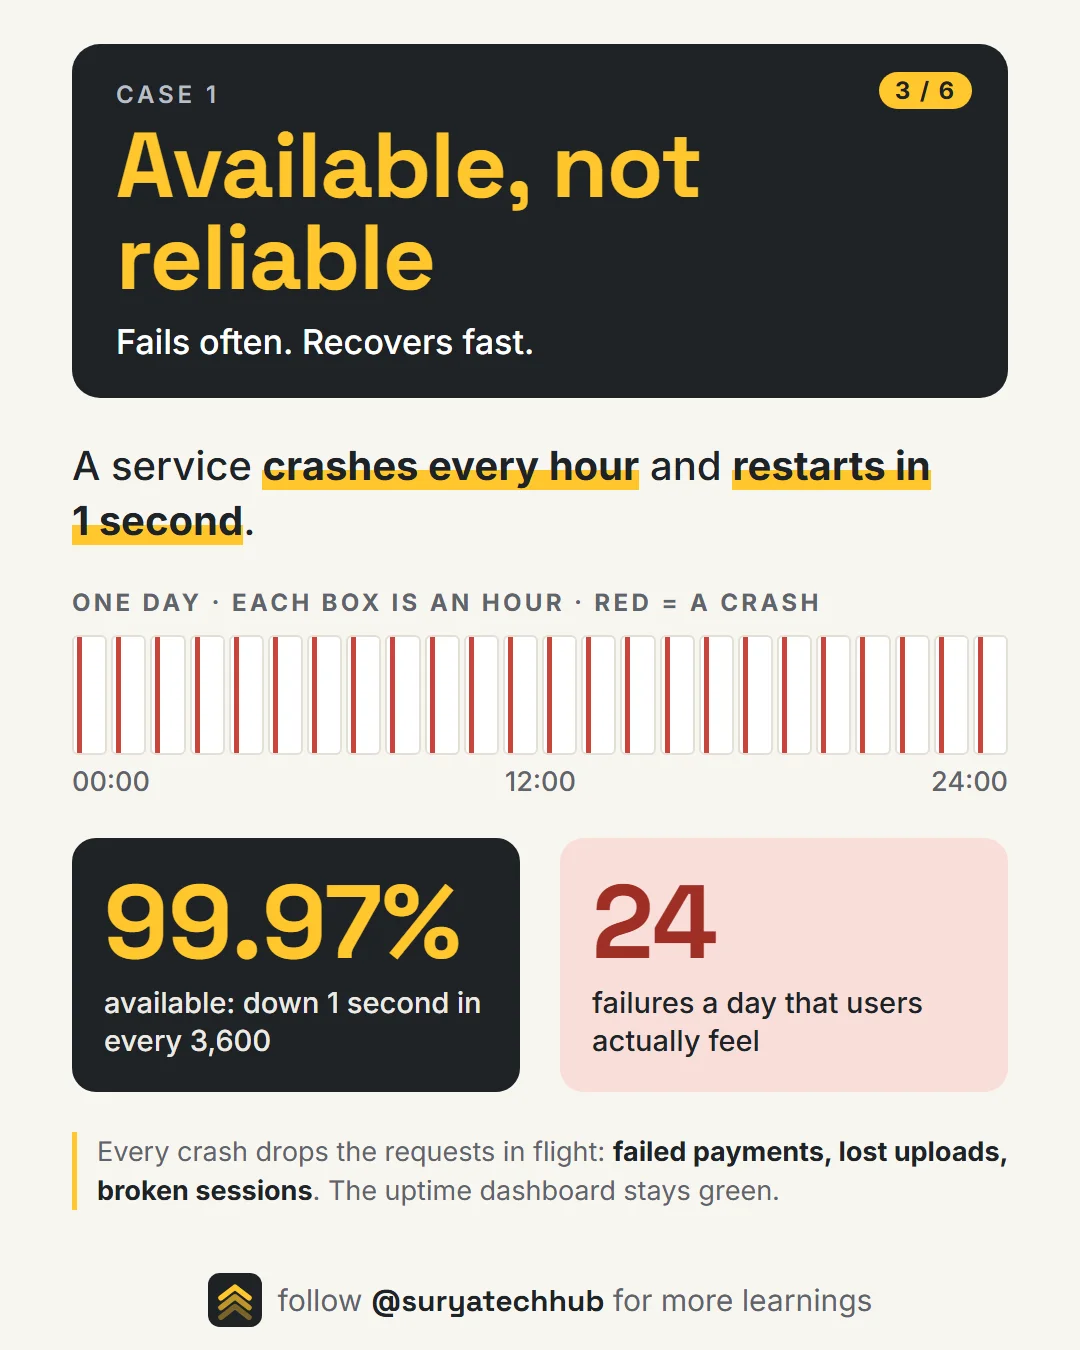
- Availability: it’s down 1 second in every 3,600, so 3,599 ÷ 3,600 = 99.97%.
- Reliability: it fails 24 times a day.
Each crash drops whatever was in flight: a payment halfway through, a file upload, a user’s session. Over a year that’s 8,760 crashes but only about 2.4 hours of total downtime, which is comfortably inside a 99.9% target. On paper, you meet your SLA. In practice, users hit errors every hour.
This is the most common way teams fool themselves. Fast restarts (Kubernetes restarting a pod, a process supervisor relaunching a crashed worker) keep the uptime number high while hiding a system that keeps falling over.
Case 2: reliable, but not available
Now flip it. A system fails once a year, but restoring it takes 3 days.
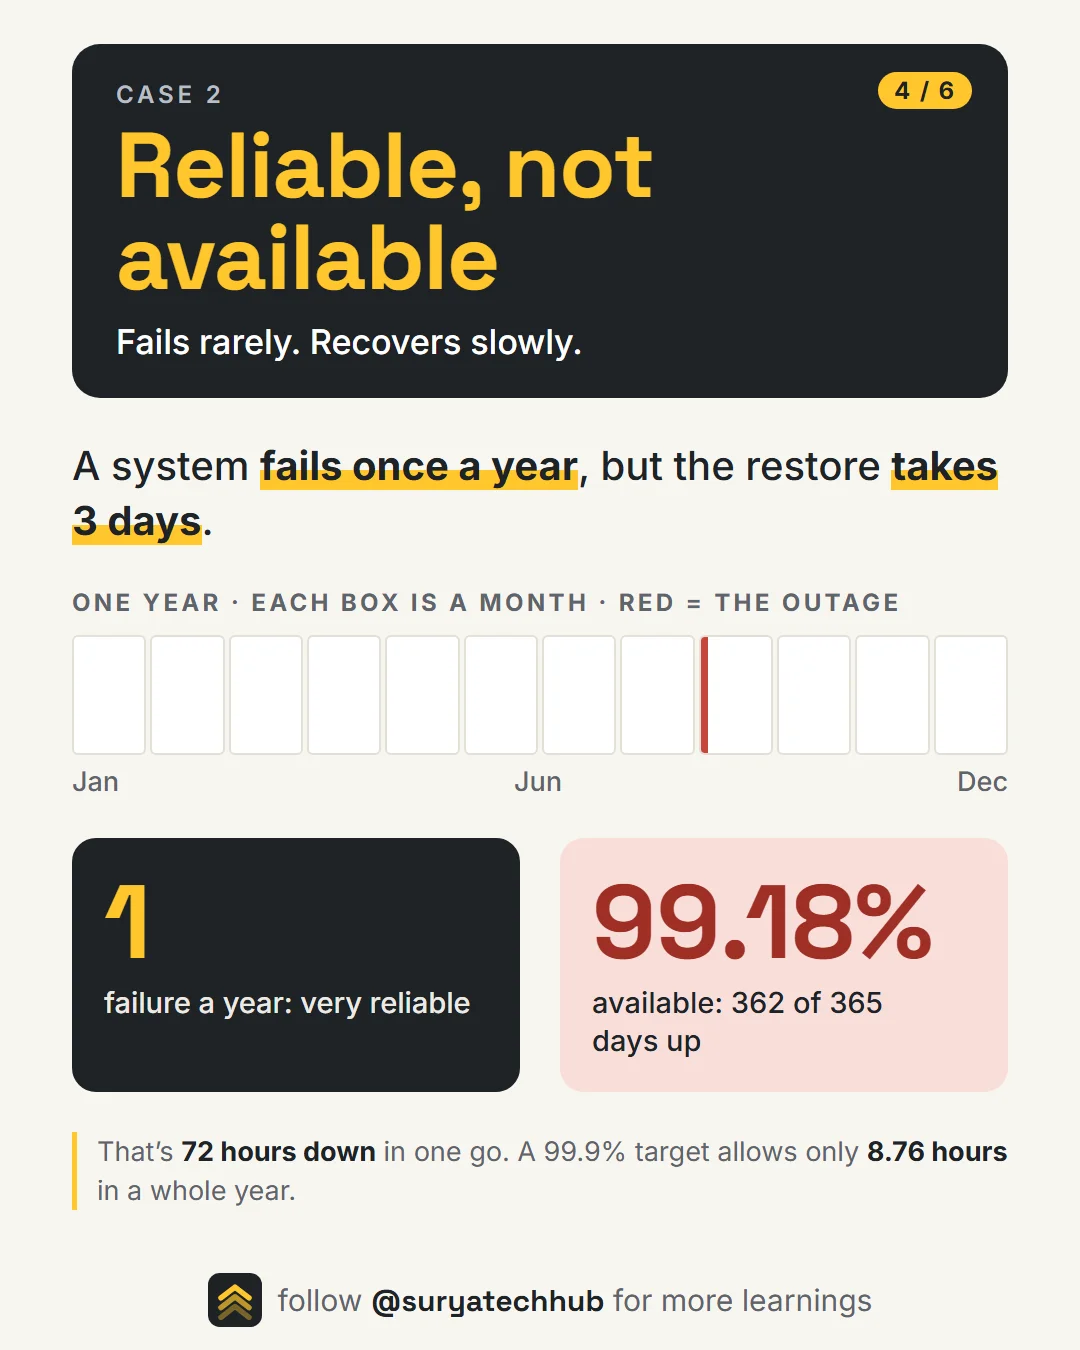
- Reliability: MTBF is a year. That’s very reliable.
- Availability: it’s up 362 of 365 days, so 362 ÷ 365 = 99.18%.
That single outage is 72 hours of downtime. A 99.9% target allows only 8.76 hours in a whole year. This is what happens when failures are rare enough that nobody practises recovery: the backups were never restored in a drill, the runbook is out of date, and the one person who knows the system is on leave.
The formula that connects them
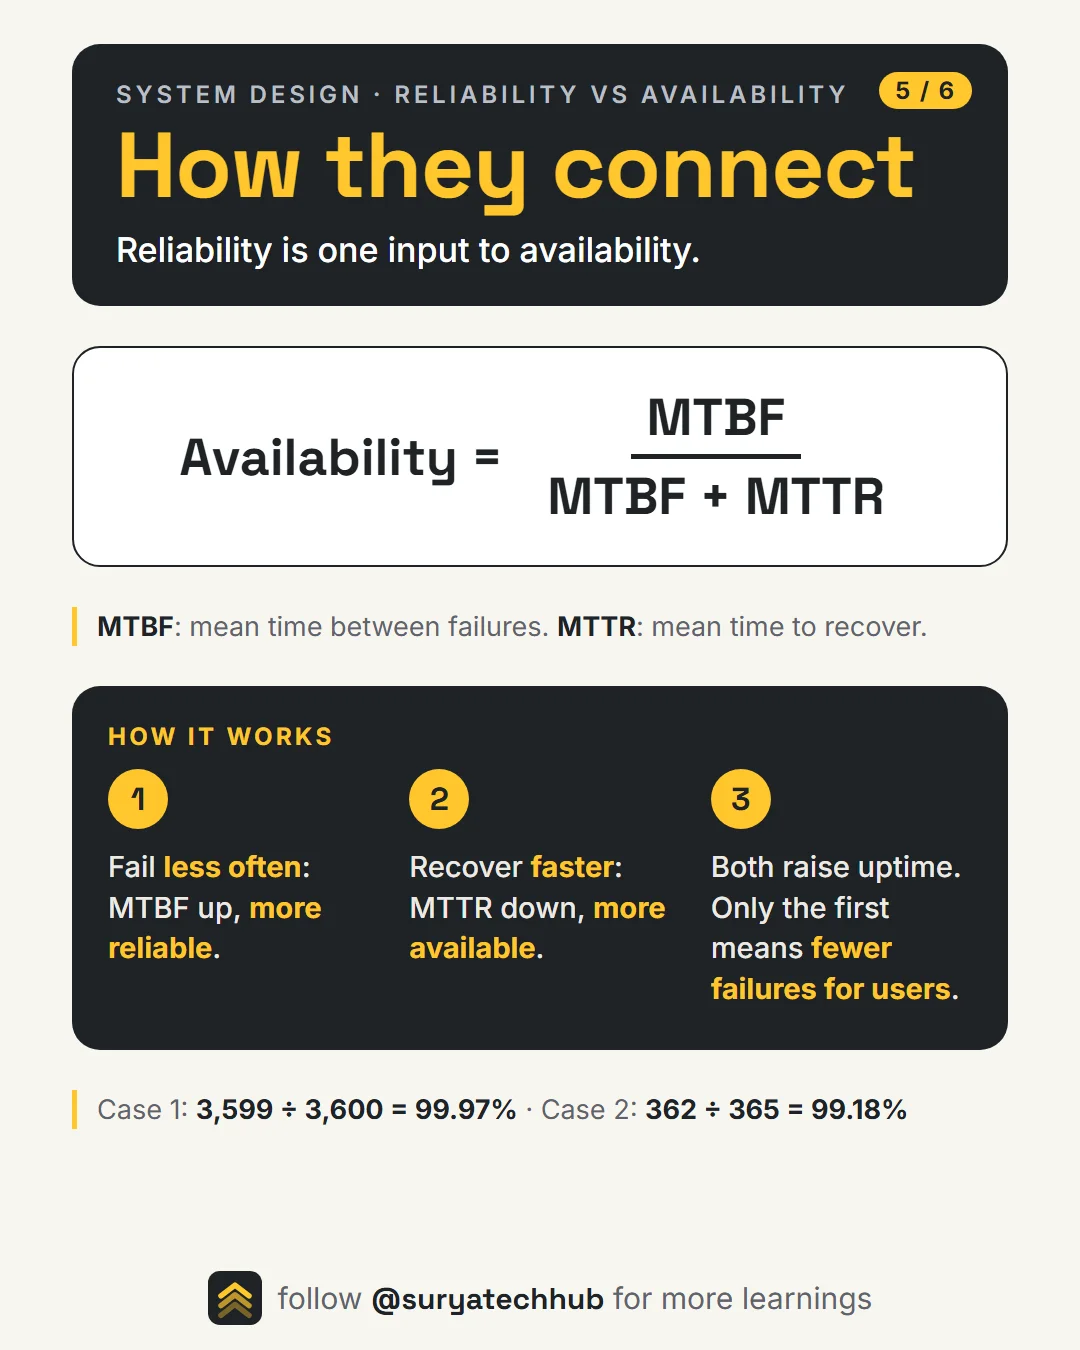
The link between the two is one formula:
Availability = MTBF ÷ (MTBF + MTTR)
- MTBF (mean time between failures): how long the system runs, on average, before it fails.
- MTTR (mean time to recover): how long it takes, on average, to get back up after a failure.
Check it against both cases:
| MTBF | MTTR | Availability | |
|---|---|---|---|
| Case 1 | 3,599 seconds | 1 second | 3,599 ÷ 3,600 = 99.97% |
| Case 2 | 362 days | 3 days | 362 ÷ 365 = 99.18% |
The formula shows why the two words get confused: reliability is one input to availability. There are two ways to raise availability:
- Fail less often. MTBF goes up, so the system becomes more reliable, and availability rises.
- Recover faster. MTTR goes down, so the system becomes more available, but it fails just as often.
Both make the uptime number better. Only the first means fewer failures for your users.
What the nines really allow
“Three nines” sounds close to “five nines”. In downtime, they’re far apart:
| Availability | Downtime per year | Downtime per month |
|---|---|---|
| 99% | 3.65 days | 7.3 hours |
| 99.9% | 8.76 hours | 43.8 minutes |
| 99.95% | 4.38 hours | 21.9 minutes |
| 99.99% | 52.6 minutes | 4.4 minutes |
| 99.999% | 5.26 minutes | 26 seconds |
At five nines, a human can’t even get paged, log in and read the dashboard inside the budget. Recovery has to be automatic.
Notice what the table doesn’t tell you: how many times you went down. 43 minutes in a month could be one bad incident, or 2,600 one-second crashes. Uptime alone can’t tell those apart. That’s why you track failure counts (or MTBF) next to uptime.
Two senior-level details
Dependencies multiply
If a request passes through three services in a row, each at 99.9%, the request only succeeds if all three are up:
0.999 × 0.999 × 0.999 ≈ 99.7%
Every dependency you add in series lowers your availability. Your service can never be more available than the chain it depends on, which is why a “99.99%” service that calls three 99.9% services is making a promise it can’t keep.
Redundancy adds, but only if failures are independent
Run two copies of a service, each at 99%, and the system is only down when both are down at once:
1 − (0.01 × 0.01) = 99.99%
That’s how redundancy turns two-nines parts into a four-nines system. The catch is the word independent. If both copies run the same bad deploy, share one database, or sit in the same data centre, they fail together and the maths no longer holds.
How to improve each
They’re different problems, so they need different tools.
More available: cut MTTR (recover faster)
- Redundant instances, so another copy takes over when one fails
- Health checks that spot a failure in seconds, not when a user complains
- Automatic failover to a standby database or another region
- Auto-restart of crashed processes
- Fast rollbacks, so a bad deploy is undone in minutes
More reliable: raise MTBF (fail less often)
- Testing before release: unit, integration and load tests
- Canary rollouts: send a new version to a small slice of traffic first
- Idempotent retries, so a brief network failure doesn’t become a user-facing error (idempotency, explained)
- Circuit breakers, so one failing dependency doesn’t take everything down with it
- Input validation, so bad data is rejected at the edge instead of crashing a worker
Notice the overlap: a circuit breaker and a retry also stop small faults from turning into outages. Good systems invest in both lists.
How teams set targets: SLOs and error budgets
In practice, teams don’t aim for “as available as possible”. They pick a service level objective (SLO), for example “99.9% of requests succeed over 30 days”. Many teams measure availability this way, as successful requests ÷ total requests, because that’s closer to what users feel than whether a server is running.
The gap to 100% is the error budget: about 43 minutes a month at 99.9%. While there’s budget left, the team ships features. When it runs out, the focus switches to reliability work. This turns “reliability vs availability” from a debate into a number both product and engineering can see.
Checklist
- ✅ Availability = is it up right now? Measured as uptime %.
- ✅ Reliability = how long it runs before it fails. Measured as MTBF.
- ✅ Availability = MTBF ÷ (MTBF + MTTR): reliability is one input to it.
- ✅ Fast restarts can hide an unreliable system behind a high uptime number.
- ✅ Rare failures with slow recovery can wreck availability.
- ✅ Track failure counts next to uptime, not just uptime.
- ✅ Dependencies in series multiply availability down; independent redundancy pushes it up.
Good systems need both: fail rarely, and when they do, recover fast.